COMMON CLUSTERING ALGORITHMS (PART 2)
DBSCAN
DBSCAN is short for Density-Based Spatial Clustering of Applications with Noise, which is presented in the paper A Density-Based Algorithm for Discovering Clusters in Large Spatial Databases with Noise.
It requires two parameters:
- eps (epsilon): The maximum distance between two data points to be considered as a cluster;
- minPts: The minimum number of points to form a dense region.
DBSCAN works as below:
- Arbitrarily choose a data point in the dataset (until all points have been visited);
- Check whether there are at least
minPtspoints within the area of radiuseps. If yes, consider all of them to be part of the same cluster.
Unlike K-Means, DBSCAN does not need to specify the number of clusters. Besides, since K-Means forms clusters based on the mean value of cluster points, a slight change in data points might affect the outcome.
However, it is challenging for DBSCAN to deal with data points with unbalanced density due to the fixed epsilon.
K-Means
Basically, given k as the number of centroids, K-means algorithm allocates every data point to the nearest cluster, while keeping the centroids as small as possible.
- Randomly choose
kdata points as centroids - For every other data points in the dataset, assign them to the closest centroid based on a specific distance metric (e.g. Euclidean distance)
- Re-calculate the centroid of each cluster
- Repeat the iteration until condition met
How to Determine the Optimal Value of K
I. The Elbow Method
Calculate the Within-Cluster-Sum of Squared Errors (WSS) for different values of k, and choose the k for which WSS becomes first starts to diminish. In the plot of WSS-versus-k, this is visible as an elbow.
The within-cluster sum of squares demonstrates the variability within each cluster. A cluster with smaller WSS values is more compact and has less variability.
To Calculate WSS, we calculate Squared Error, which is the square of the distance between every data point and it’s corresponding centroid, then sum up all Squared Errors as WSS.
For example, in the following figure, the elbow is at k=4.
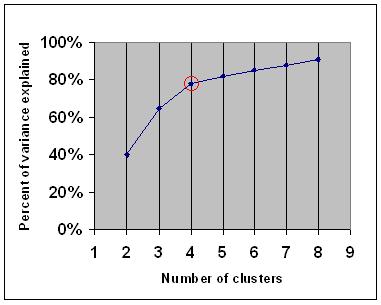
However, the curve could be much more ambiguous than this one.
II. Gap Static
In the paper Estimating the number of clusters in a data set via the gap statistic, Tibshirani et al. presented a method, that is called gap static:
- Cluster the data and denote the number of clusters as k=1, …, kmax
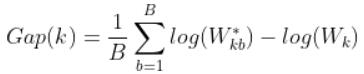
- Generate B reference data sets with a random uniform distribution. Cluster each of these reference data sets with varying number of clusters k=1, …, kmax, and compute the corresponding total within intra-cluster variation Wkb
- Compute the estimated gap statistic as the deviation of the observed Wk value from its expected value Wkb under the null hypothesis:
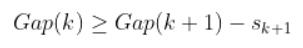
- Choose the number of clusters as the smallest value of k such that:
III. The Silhouette Method
Basically, the silhouette method
Compute silhouette coefficients for each of point, and average it out for all the samples to get the silhouette score.
To compute silhouette coefficient:
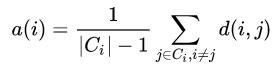
- Compute a(i), the mean distance between i and all other data points in the same cluster:
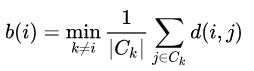
- Compute b(i), the minimum mean distance of i to all points in any other cluster, of which i is not a member
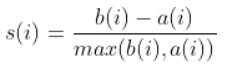
- Compute the silhouette coefficient:
K-Means++
K-Means++ adds a initialization on choosing starter centroids:
- Randomly choose the first centroid from data points;
- For each data point, calculate the distance between it and it’s corresponding centroid (the nearest one);
- Use the distance as a probability, that the larger distance a point has, the larger probability that this point will be selected as the next centroid;
- Repeat step 2 and 3 until k centroids are selected.
Mini Batch K-Means
Mini Batch K-Means is almost similar to K-Means:
- Randomly choose b samples from dataset to form a mini-batch;
- Assign them to the closest centroid;
- Calculate the streaming average of the sample and all previous samples assigned to that centroid;
- Repeat step 2 and 3 until certain condition is met.
Using mini batches would save lots of time compared to K-Means, as not all data points would be included to calculate centroids in each iterations. However, sampling may also reduce the accuracy.
References
- DBSCAN Clustering Algorithm in Machine Learning
- 【机器学习】K-means(非常详细)
- 2.3. Clustering - scikit-learn 0.24.1 documentation
- How to Determine the Optimal K for K-Means?
- Elbow method (clustering)
- Interpret all statistics and graphs for Cluster K-Means
- Estimating the number of clusters in a data set via the gap statistic Determining The Optimal Number Of Clusters: 3 Must Know Methods
- Silhouette Method - Better than Elbow Method to find Optimal Clusters
- Silhouette (clustering)
- ML - K-means++ Algorithm - GeeksforGeeks